Match Report Q&A with Beatrice Barlassina
Frederik Hvillum

The new Match Report gives coaches a one-page read on every match, and each stat links to the moment in the video behind it. Beatrice Barlassina, Product Manager at Veo, explains why the team built it, how coaches shaped what went into it, and what it took to make AI-generated stats that coaches can trust.
We've introduced Match Report, a six-tab report that Veo builds automatically after every match in Veo Analytics 2. It started with what coaches told us. They wanted the story of the game and the numbers behind it, without having to build it themselves.
Match Report brings together the match's AI-detected events and physical tracking data and lays them out across six tabs, from Overview to Player stats. Most stats link to the moment in the video they came from, so you can click a number and watch what happened. At the top, Coach Assist adds a short AI insight on what decided the match.
To learn more, we sat down with Beatrice Barlassina, Product Manager at Veo, and asked how the team built it and how coaches shaped it.
1. What inspired Match Report? What problem were you trying to solve for coaches?
Coaches told us they wanted the story of the game and the numbers behind it, without having to build it themselves. The Editor is brilliant when you have time for a deep review, but most coaches, especially at youth level, are fitting analysis around work, family, and training.

So we asked: what would it look like to give every coach a quick, clear read on the match?
Match Report is the answer. It’s a single page, structured the way coaches already debrief a game, where you can see what happened, click any stat to watch the moment behind it, and go deeper only if you want to. It also makes Analytics 2 easier to pick up, because the insight is waiting for you rather than something you have to dig for.
2. How does it work behind the scenes, from a finished recording to a six-tab report? What were the hardest technical challenges?
Once a recording has finished processing, a coach or admin does a quick one-time setup: choose the team and confirm which side it started on. We realised selecting the starting side was essential: it ensures the data is assigned to the right team, so coaches can trust the insights they see.
Most of the stats are tied back to the exact moment in the video they came from, and Coach Assist generates its insight when the report is first opened.
Three challenges stood out:
- Building trust in AI-generated stats. Coaches need to trust the numbers. Most stats linked to a video event are clickable, so coaches can watch the moment behind the number and check it for themselves. Making those links reliable was a key part of the work.
- Making Coach Assist insights genuinely useful. An insight needs to do more than sound convincing. Every claim must be grounded in the match data, attributed to the right team and relevant to the section where it appears. We’re still refining this to make the insights consistently useful for coaches.
- Handling the realities of a match. Matches vary in length, number of players, number of periods and when teams change sides. The challenge was to handle those variations without adding complexity for the coach, so the report reflects the game as it was played.
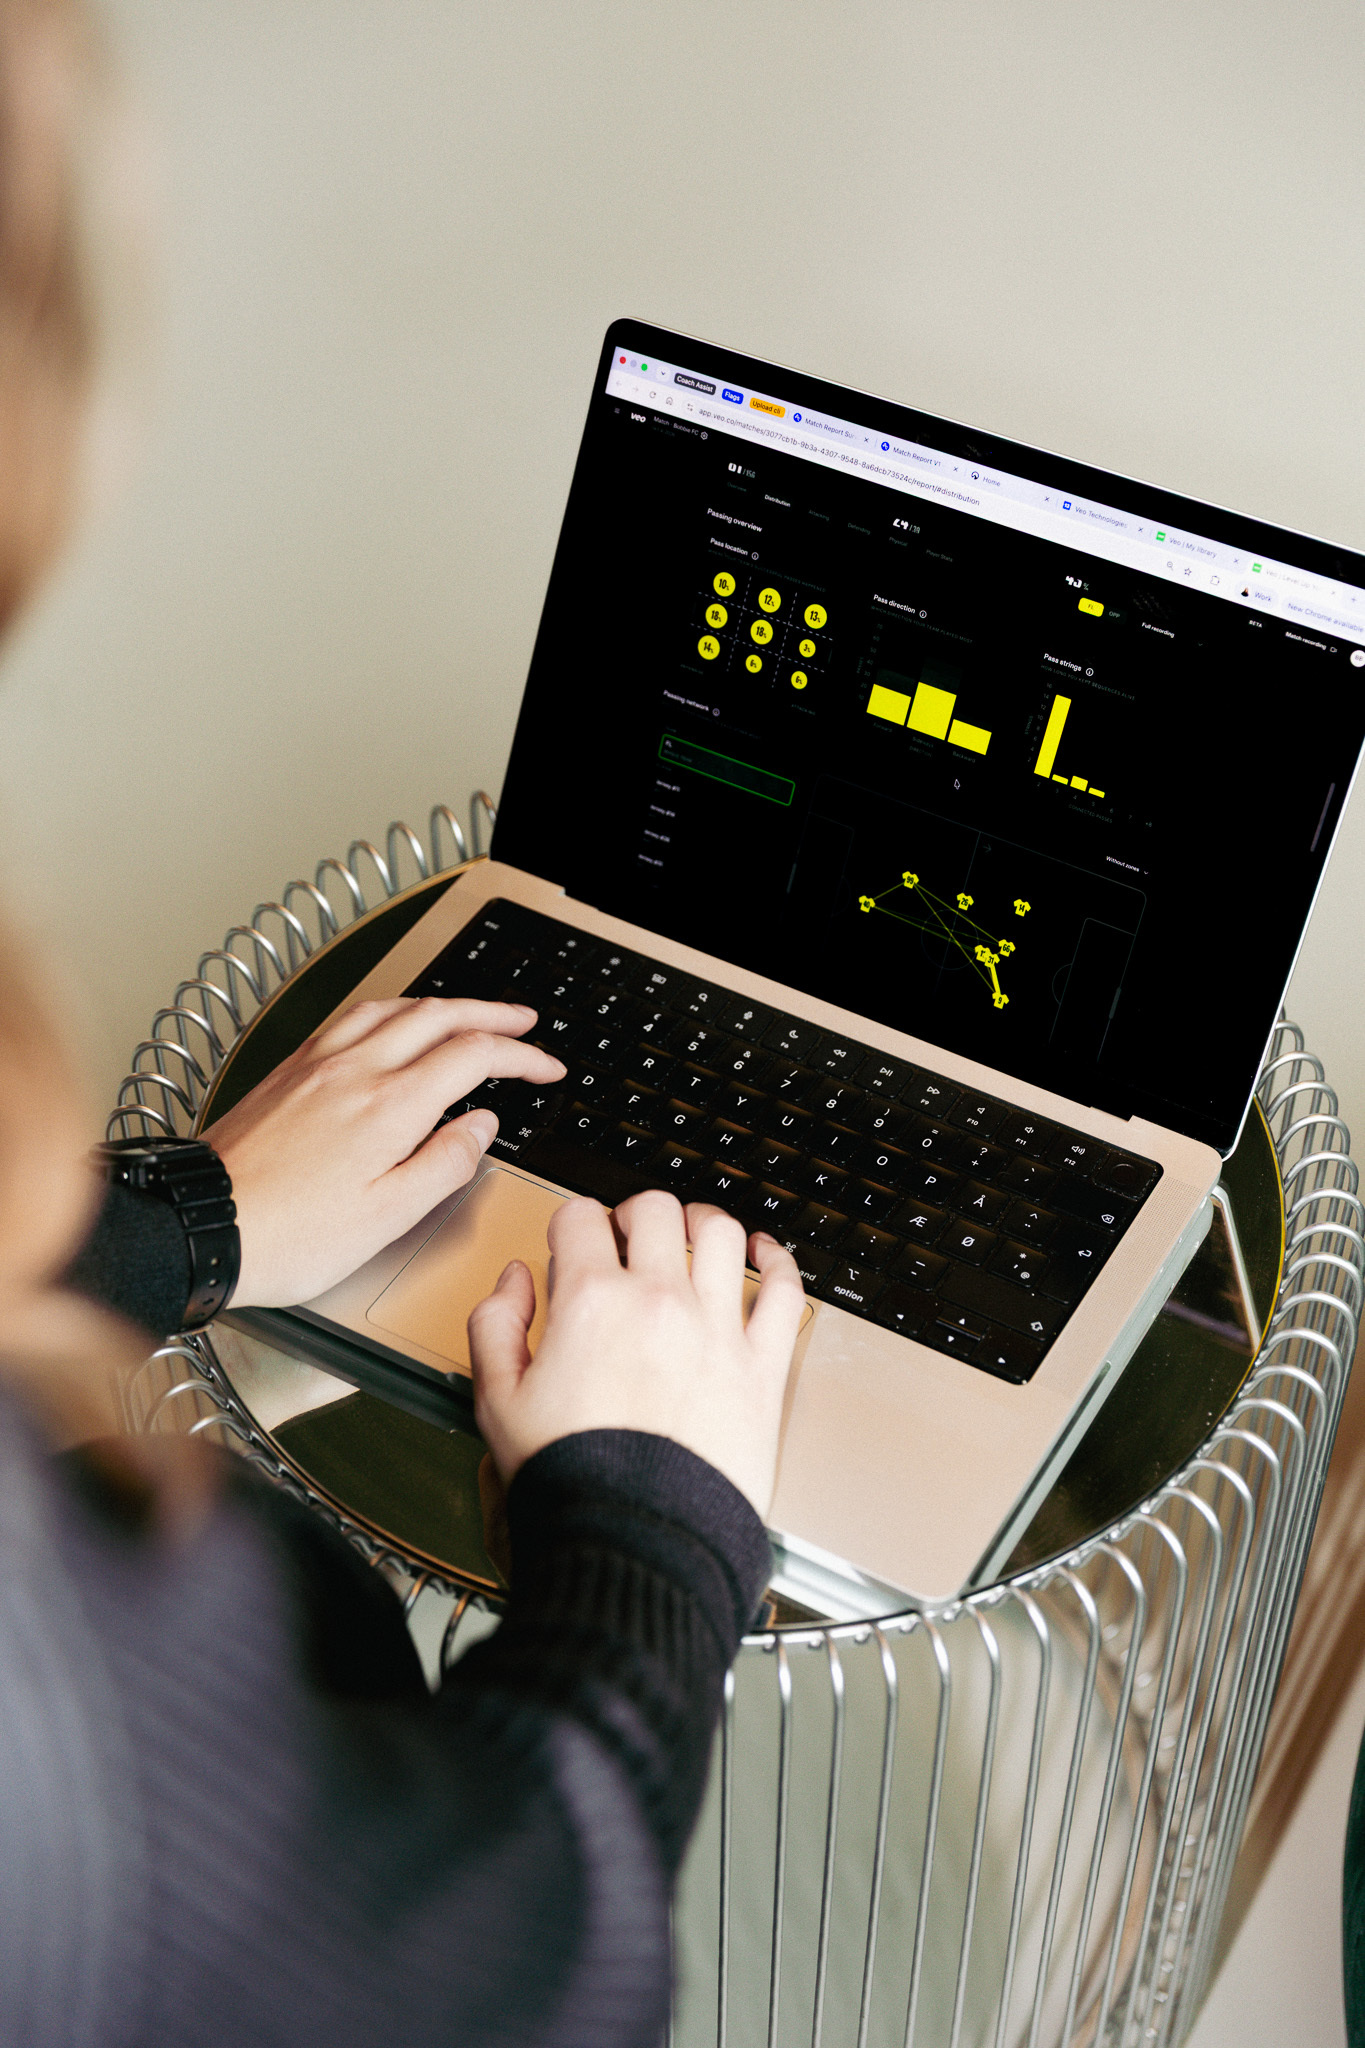
3. How did you decide what goes into the report, and what to leave out? How did coaches help shape it?
We started with how coaches review a game: what happened in possession, out of possession, and during the two transitions. Those four phases informed the report’s structure, alongside physical performance and player-level analysis.
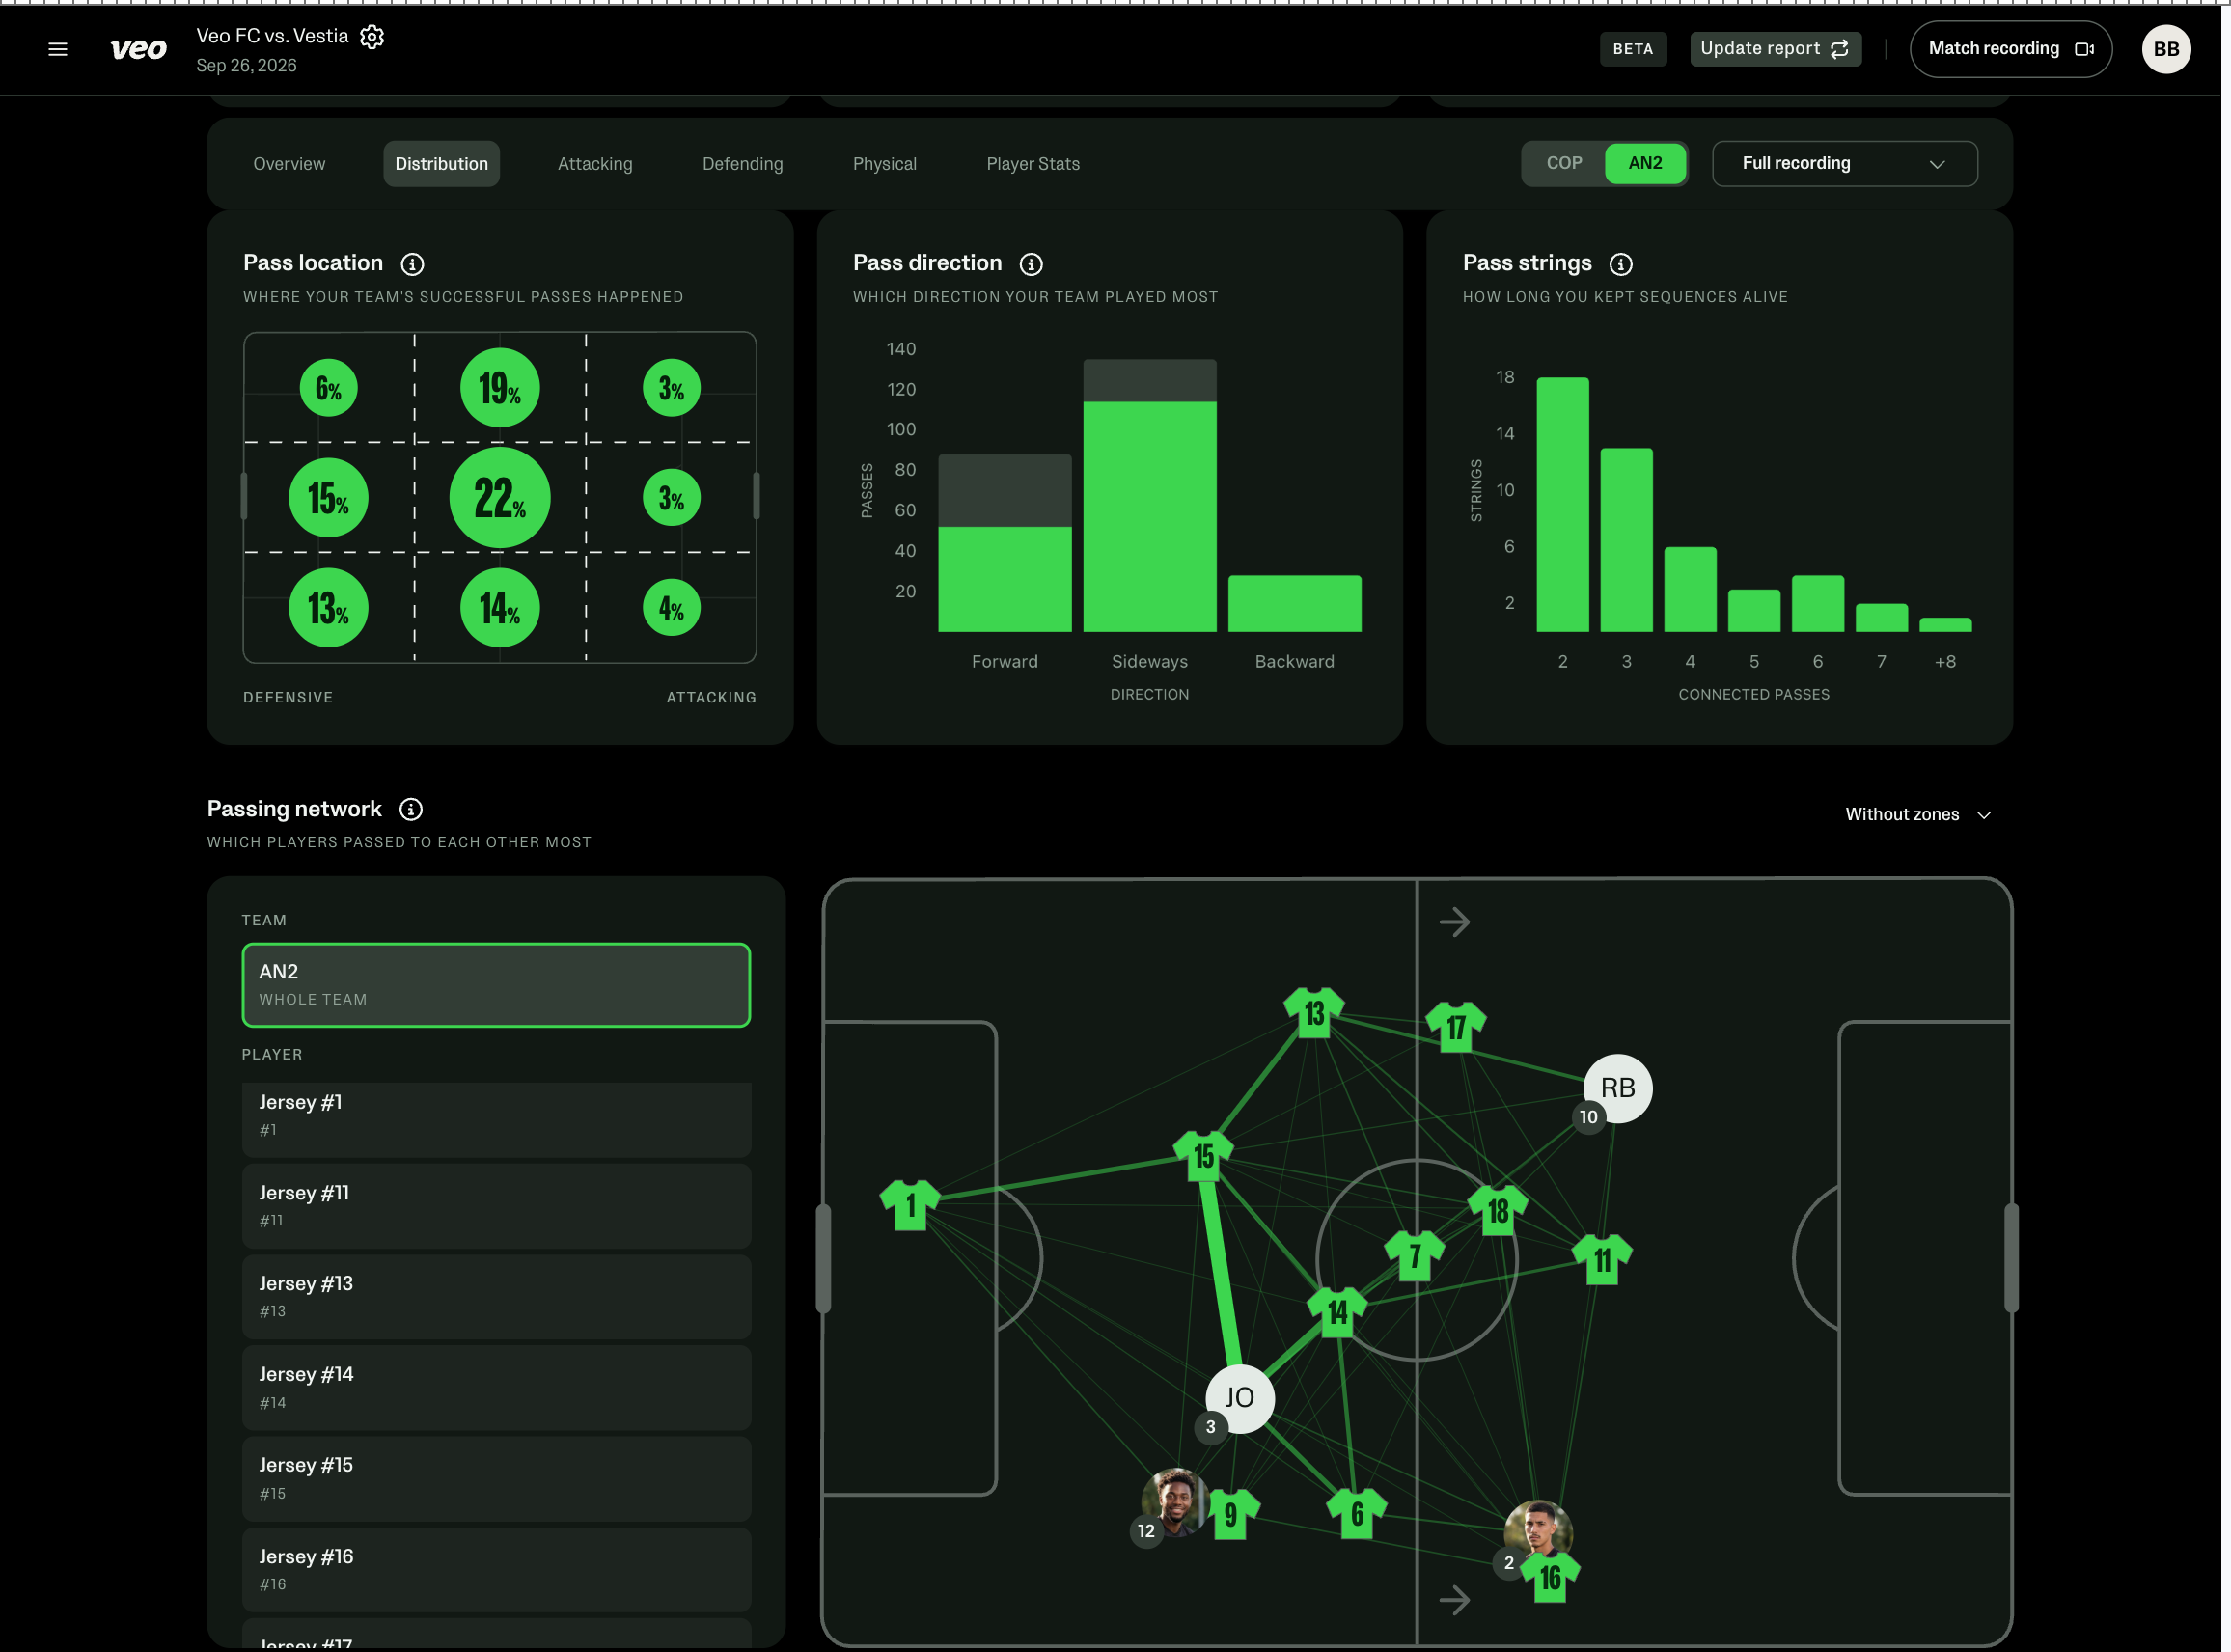
The result is six tabs: Overview, Distribution, Attacking, Defending, Physical, and Player stats. Each section answers a clear coaching question, so we chose stats and visualisations for their usefulness, not simply because we had the data.
Coaches shaped it heavily. We ran several rounds of feedback with coaches and analysts, first on designs and then on a working prototype, alongside a survey. Their feedback highlighted three priorities:
- An interactive report, not a static PDF. Coaches wanted something they could explore and use, rather than just read. The shot map stood out as a tool for one-to-one player conversations, and their feedback pushed us to make clickable stats more obvious.
- Stats first, then video. Experienced coaches said they start with the numbers to identify what deserves attention, then watch the relevant moments to understand what happened. That reinforced the overview-first layout and the direct links from stats to video.
- Insights over data. Coaches wanted help understanding the game, not simply more numbers. Pass networks helped them see how their team builds play, while high-intensity running mattered more to the coaches we spoke to than total distance or top speed. Their feedback also led us to compare against recent matches, keep the AI summary short and scannable, and add clear explanations of AI-derived stats.
We kept the first version focused on what coaches told us they’d use every week. If a metric didn’t help answer a clear coaching question or support the weekly debrief, it wasn’t a priority for the first version. That keeps the report quick to read rather than crowded. There’s more to come, and coach feedback continues to guide what we build next.
4. How does Match Report fit into the wider Analytics 2 experience, alongside Coach Assist and the rest?
Think of Match Report as the front door. It’s where you land after a match for a quick, clear story of the game. Coach Assist adds the “so what” at the top, an AI insight on what decided the match, framed around how you set up your team.
When you want to go deeper, the Editor and Analytics Studio are there for digging into events, building clips, and comparing across matches, and the report links straight into them.
Match Report is available in beta with Veo Analytics 2. Read more about Match Report.


%20(1).jpg)
.jpg)
