Team and player data, backed by video
Match events and physical metrics, tracked by AI from footage you already have.
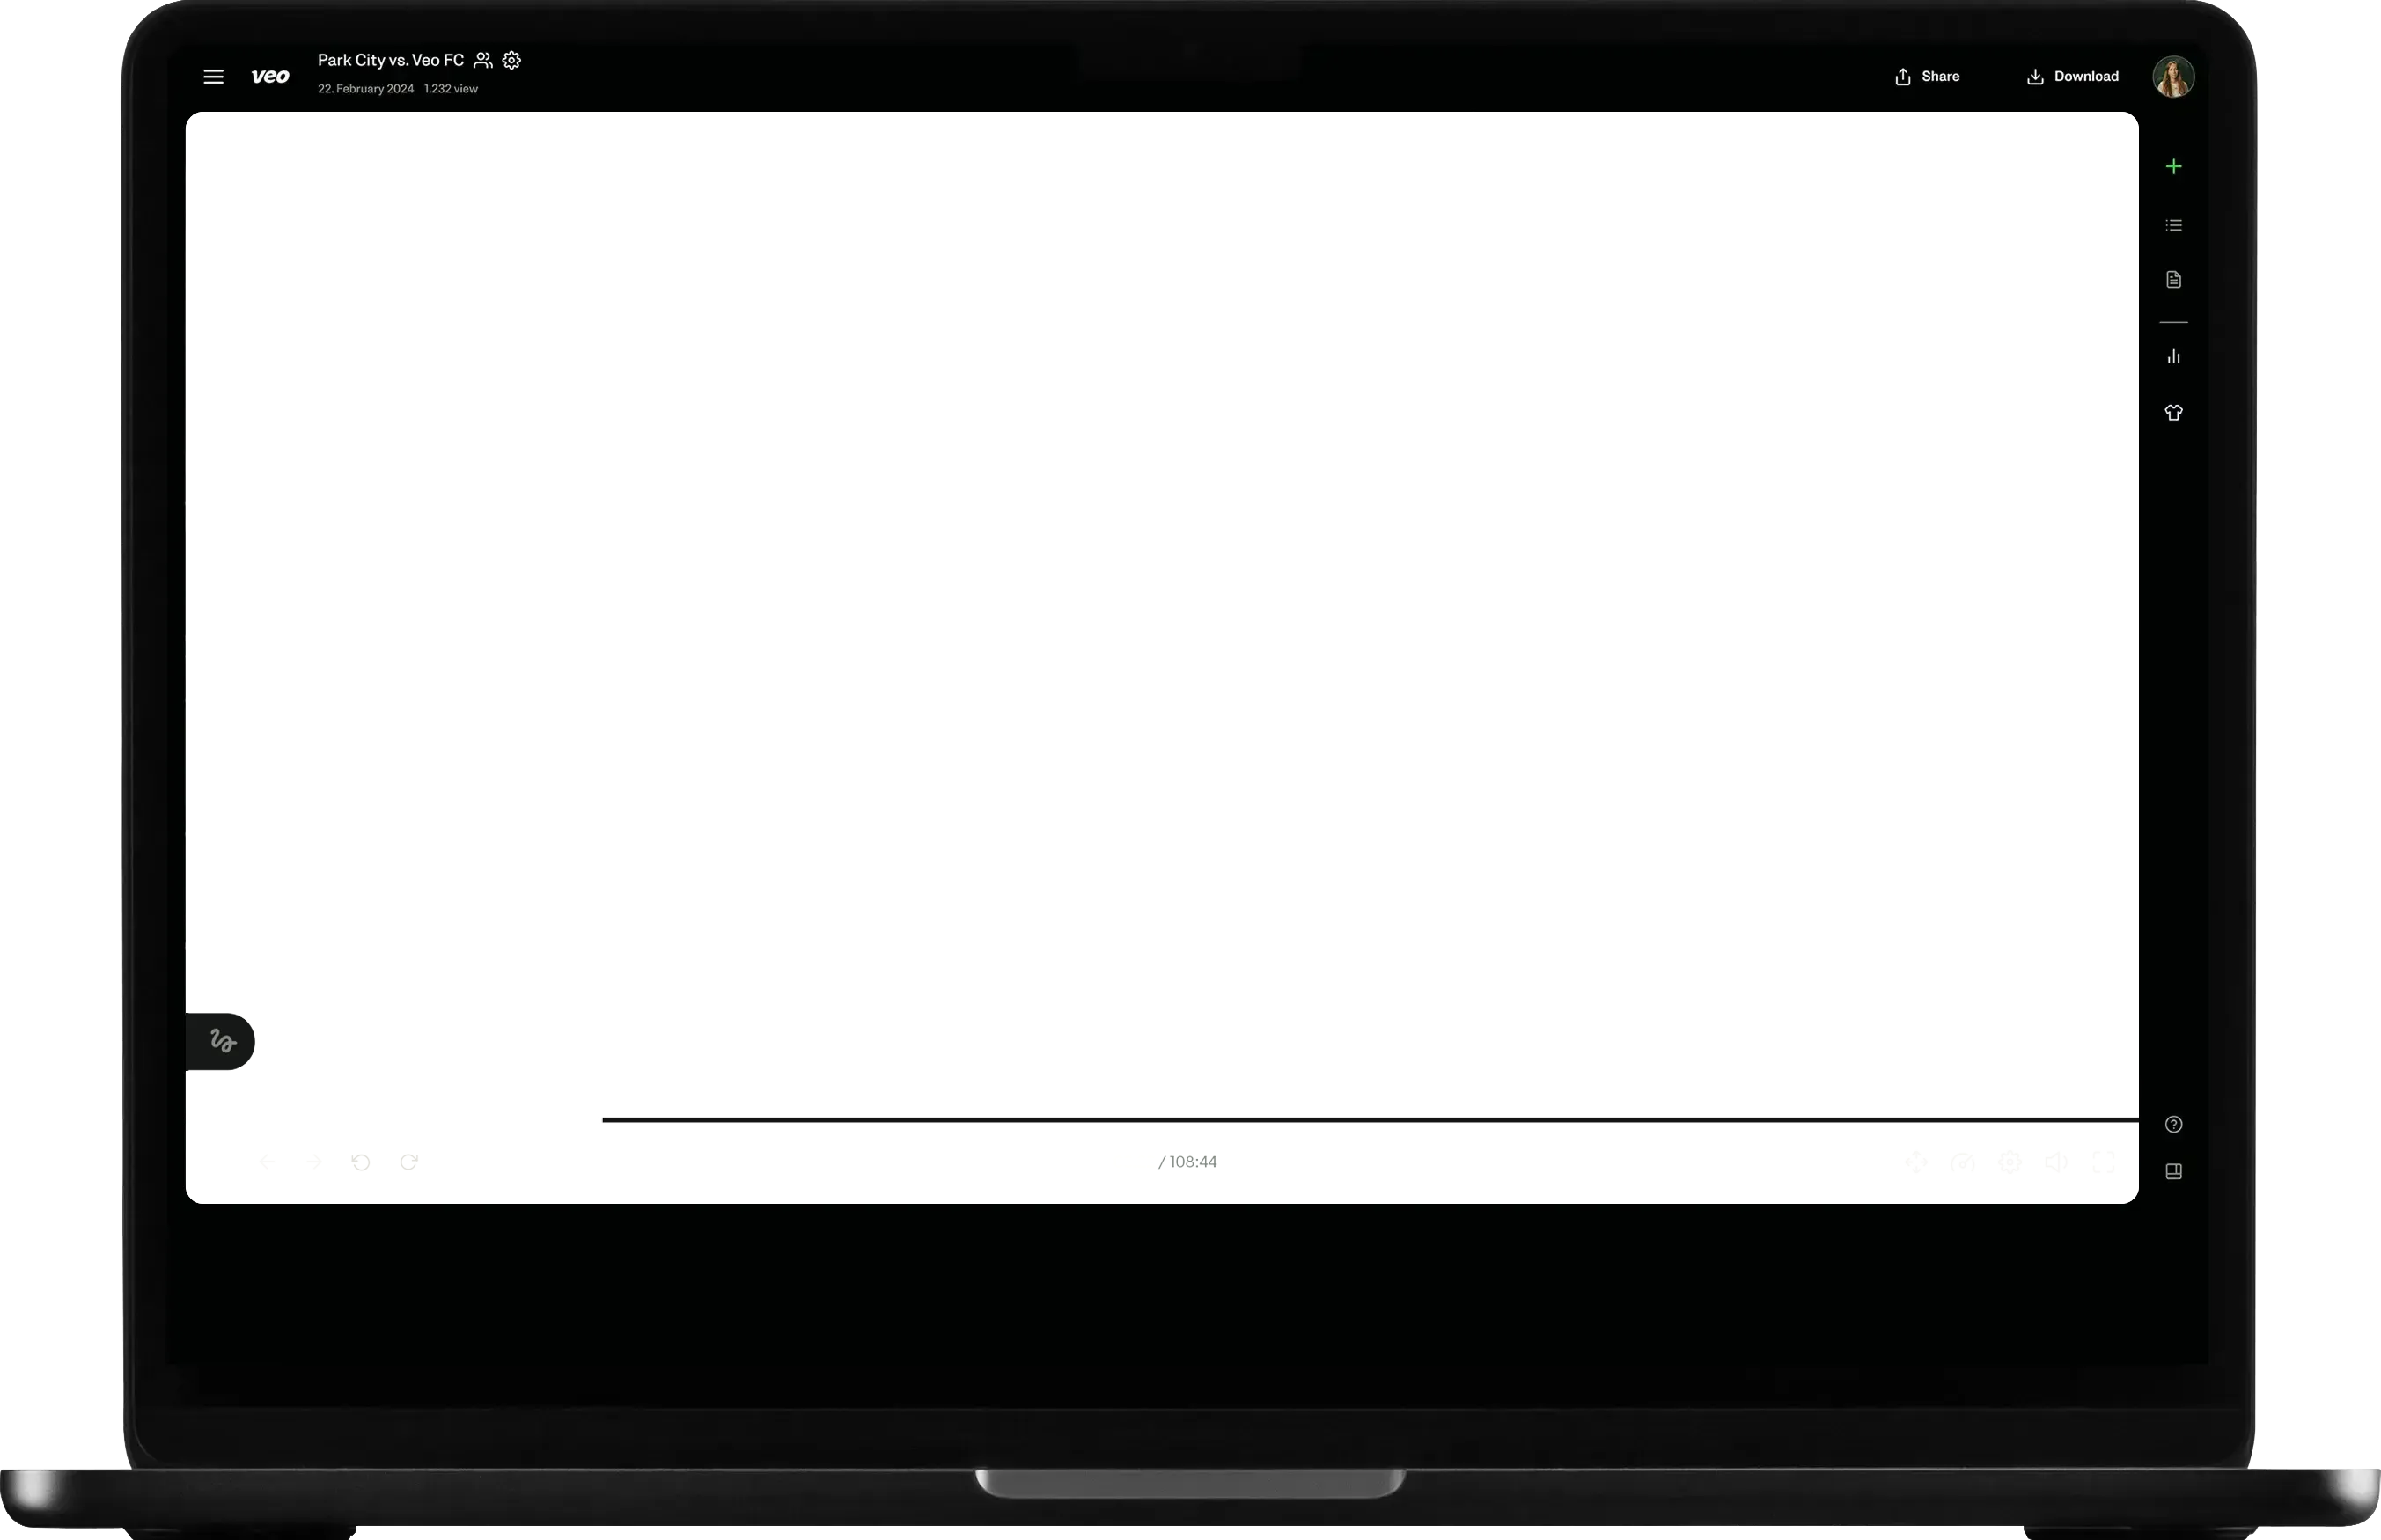
Review your match in 15 minutes
A full report of the match, built by AI, with everything you need in just one workspace.
Scroll through and tap anything
Get an instant, high-level overview of how the match went for the whole team. Tap any event to play the clip, or a player to dive into their stats.




Individual player stats
Tap a player to see their numbers, then select any stat to watch it happen.




See your match in new ways
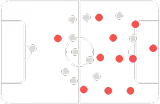
Every shot, plotted on the pitch
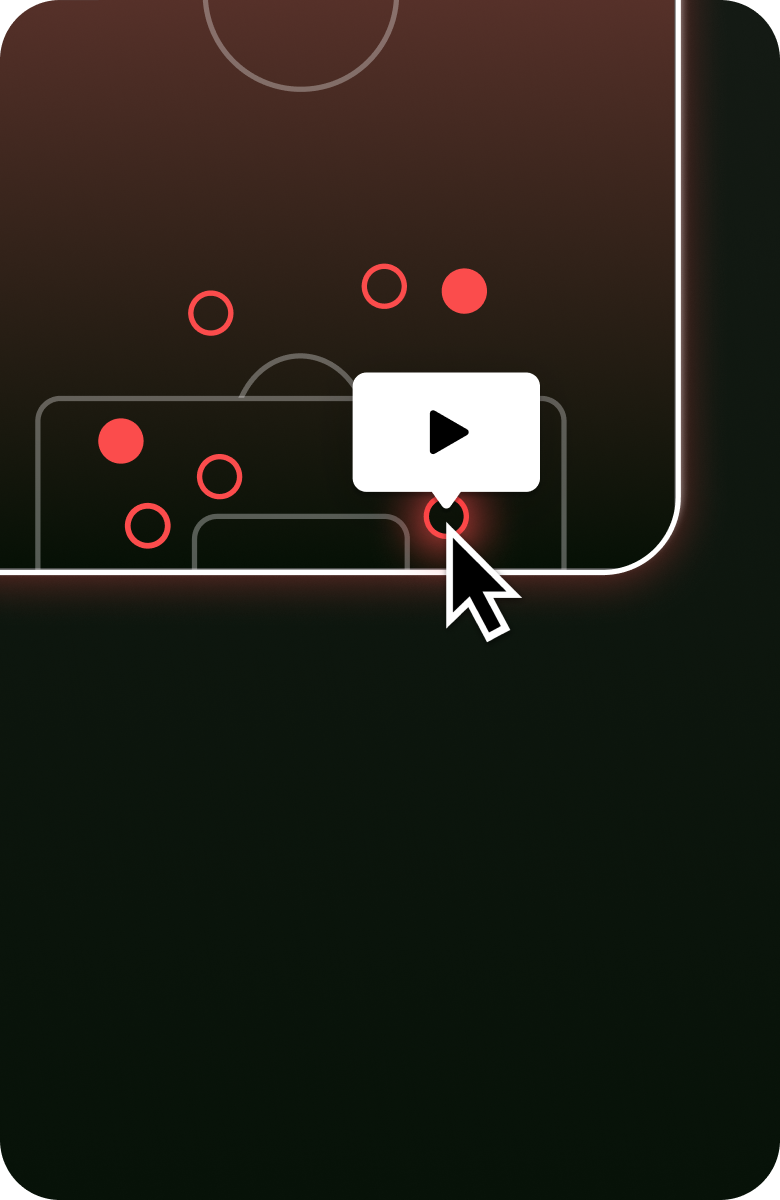
Compare where your shots came from, and where the opponent’s did too. Inside the box or out? Where are you most exposed? Click any dot to watch the shot itself.
Your match, mapped out
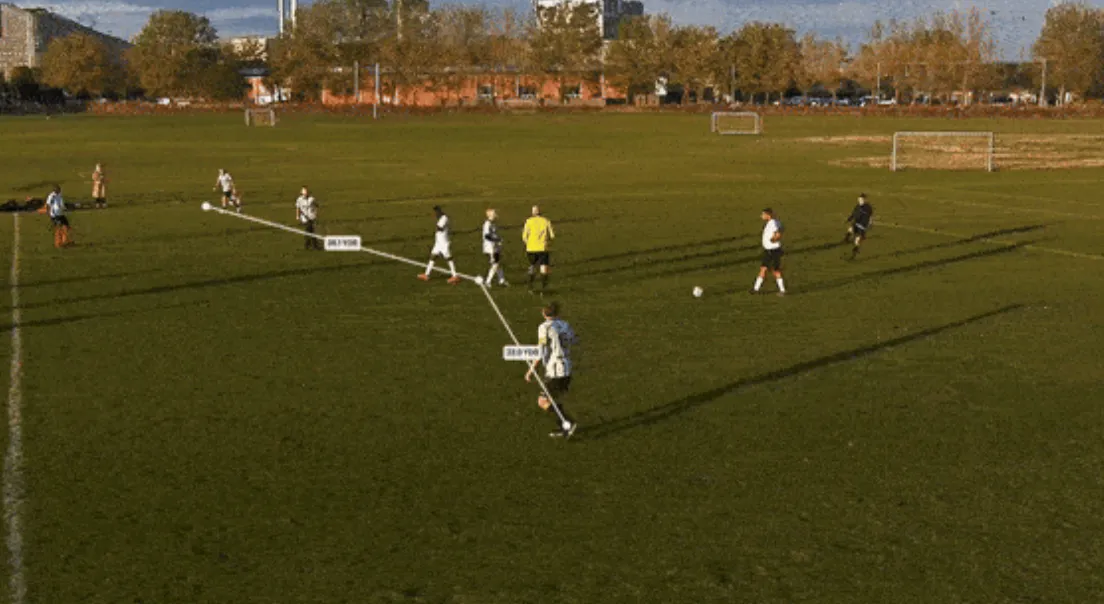
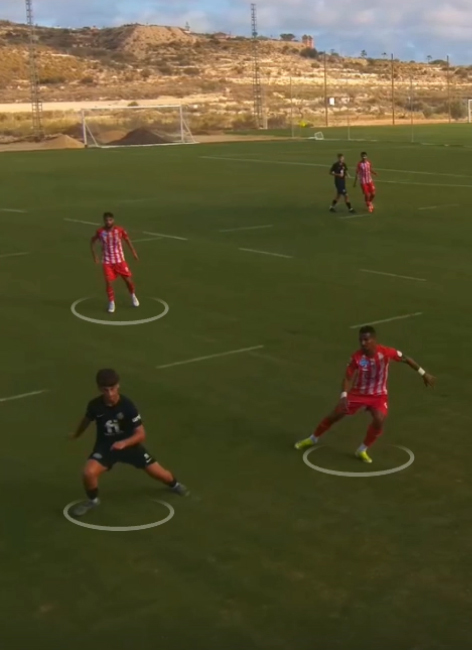
Distances between players, shown on video
Draw lines between players and watch the distance change as the match moves. Show your players how tight or stretched their shape is.
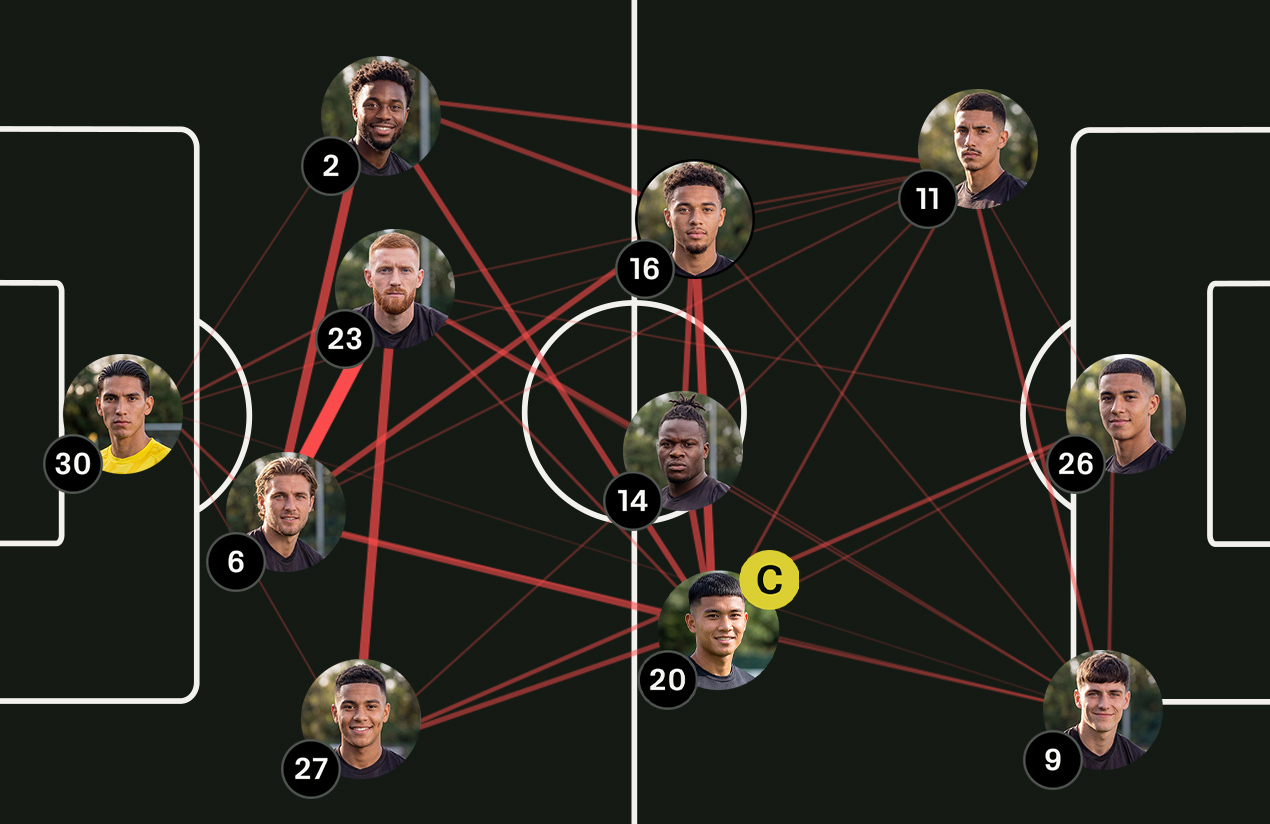
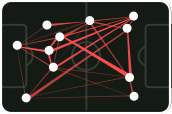
All passes mapped out
See how your team builds its passing patterns. Identify key lanes and the player connections driving your match forward.
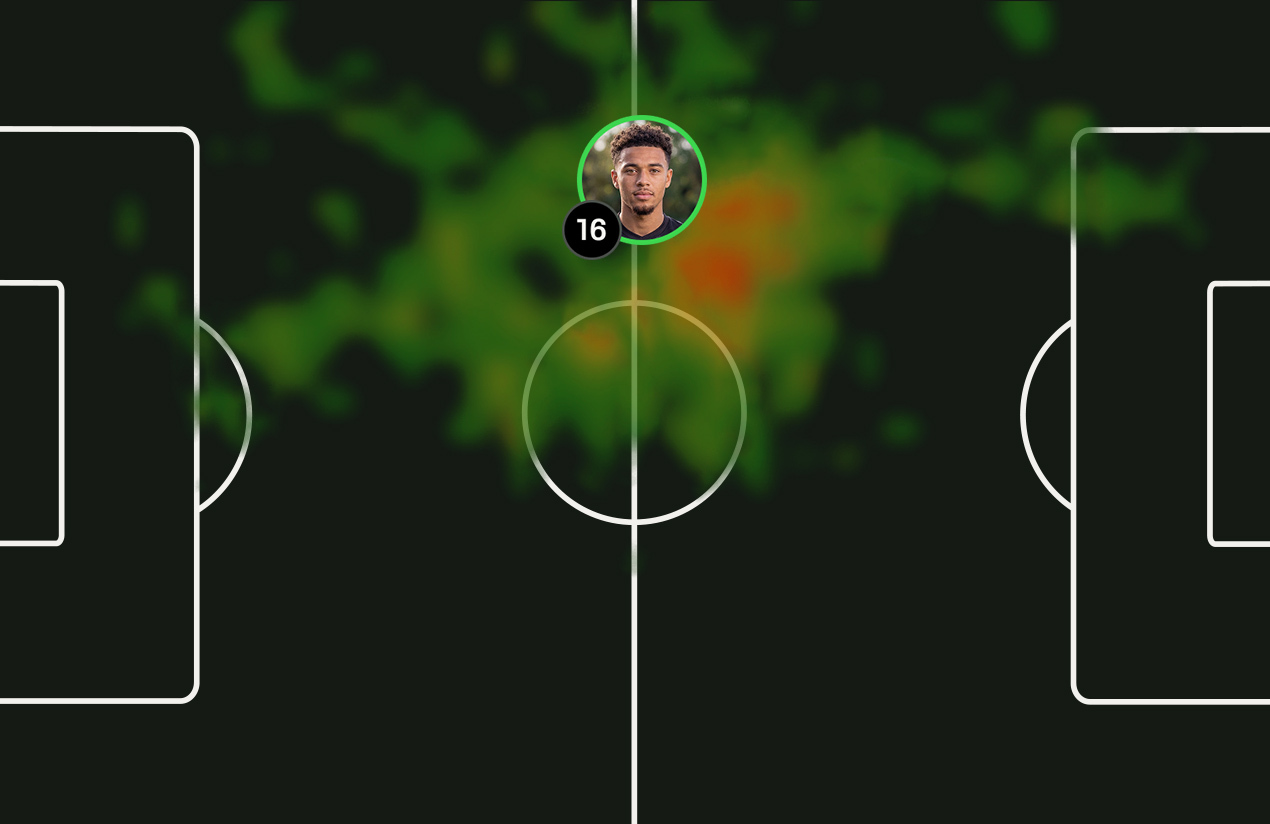
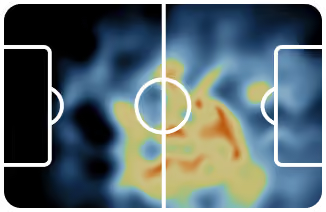
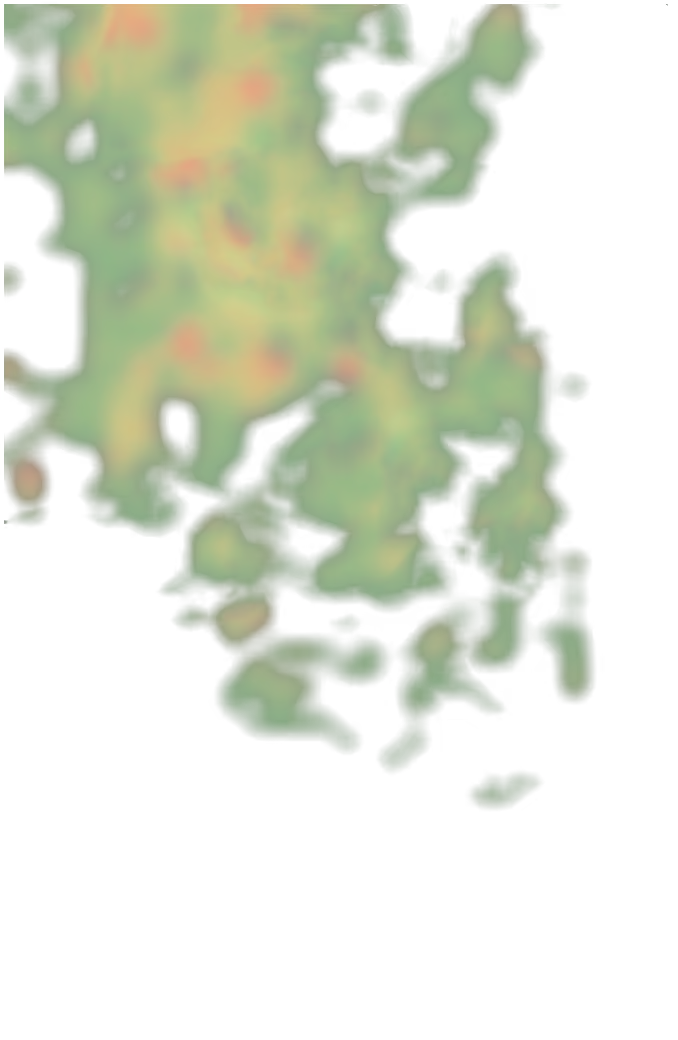
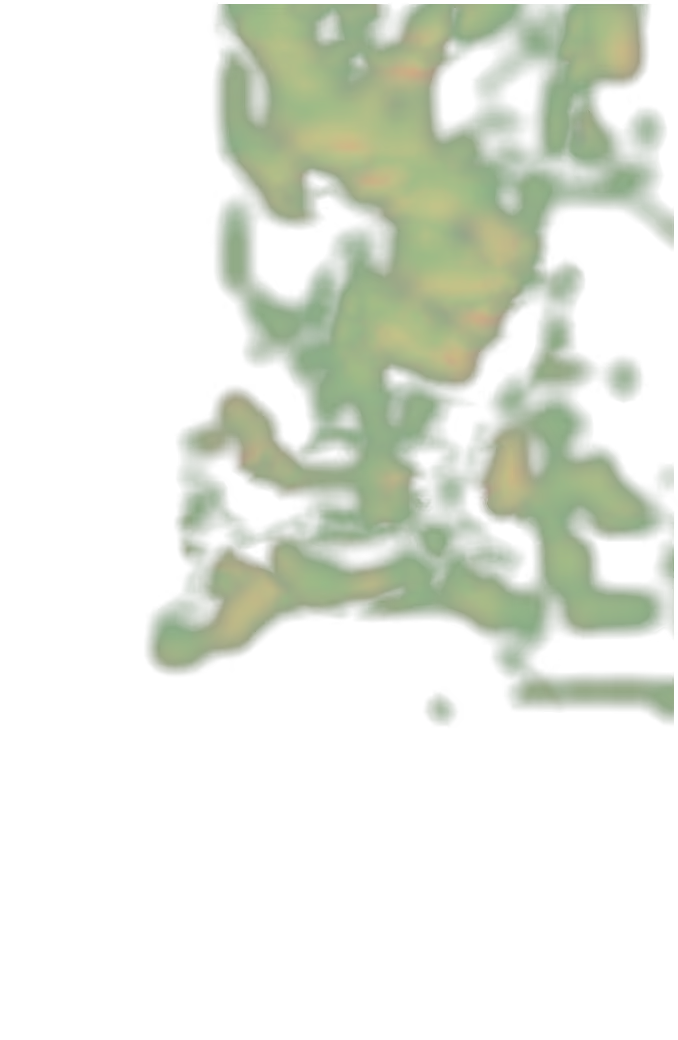
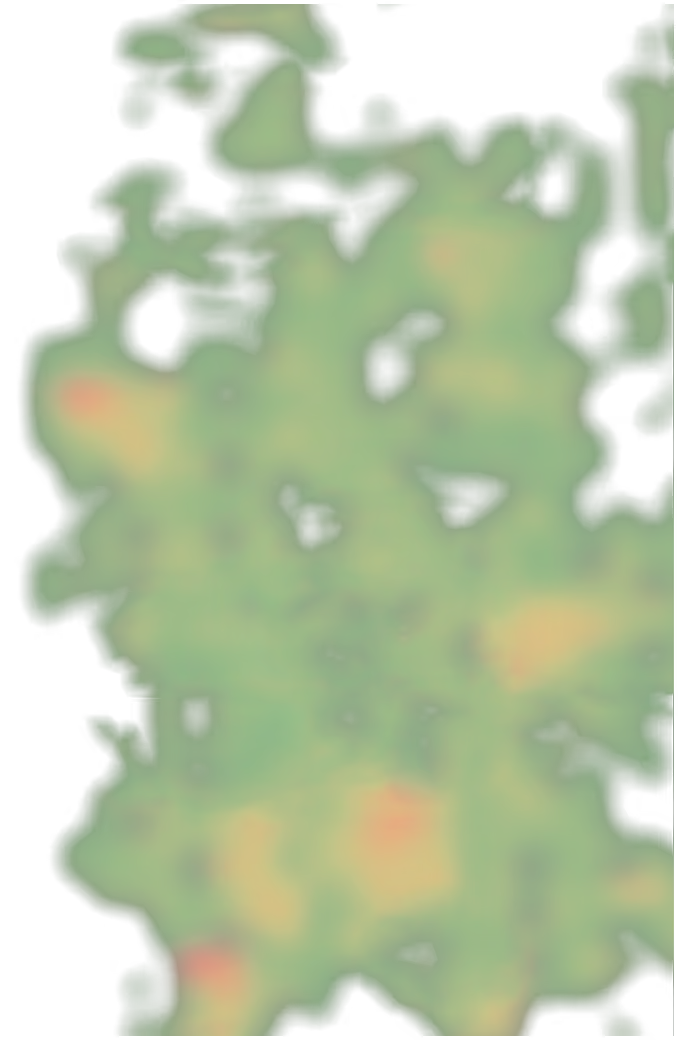
The ground your team covered
See the areas of the pitch used most, by the team or a single player, and where most time was spent during the match.
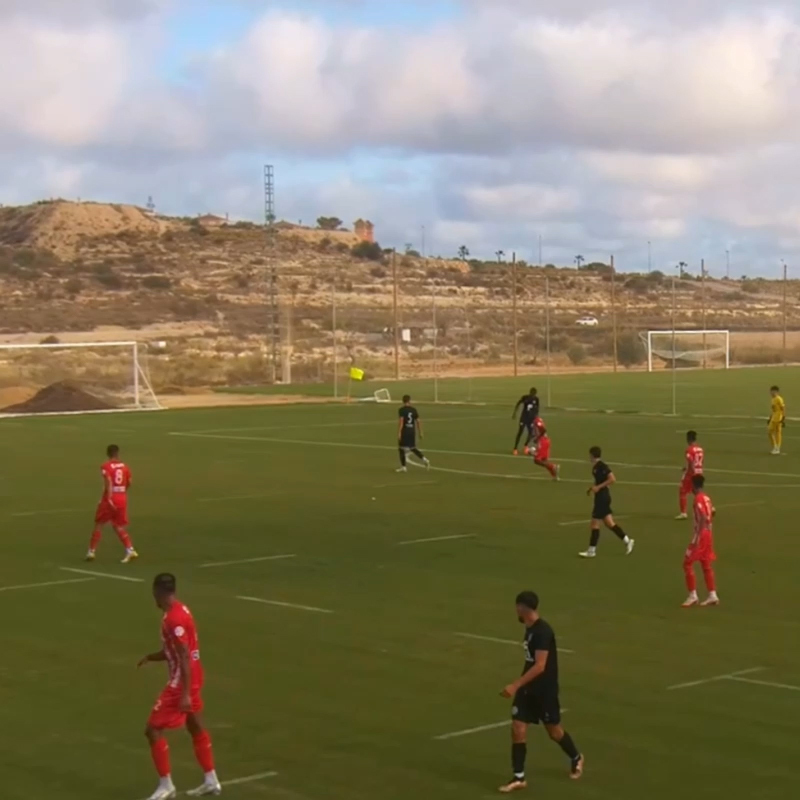











The complete passing network
Map your team's chemistry on the pitch. Identify key passing lanes and see which player connections are driving your game forward.
Click the players below to highlight their passes. See team positioning across the match or in key moments. Spot space, understand movement, and find areas to exploit.
Click the players below to see each heat map.



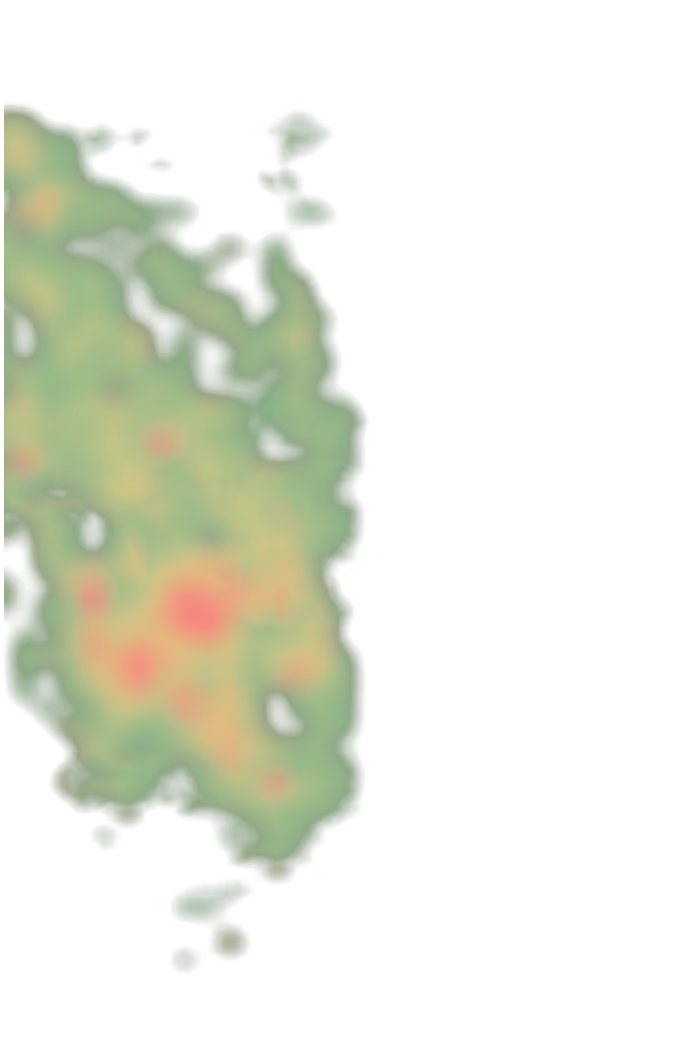
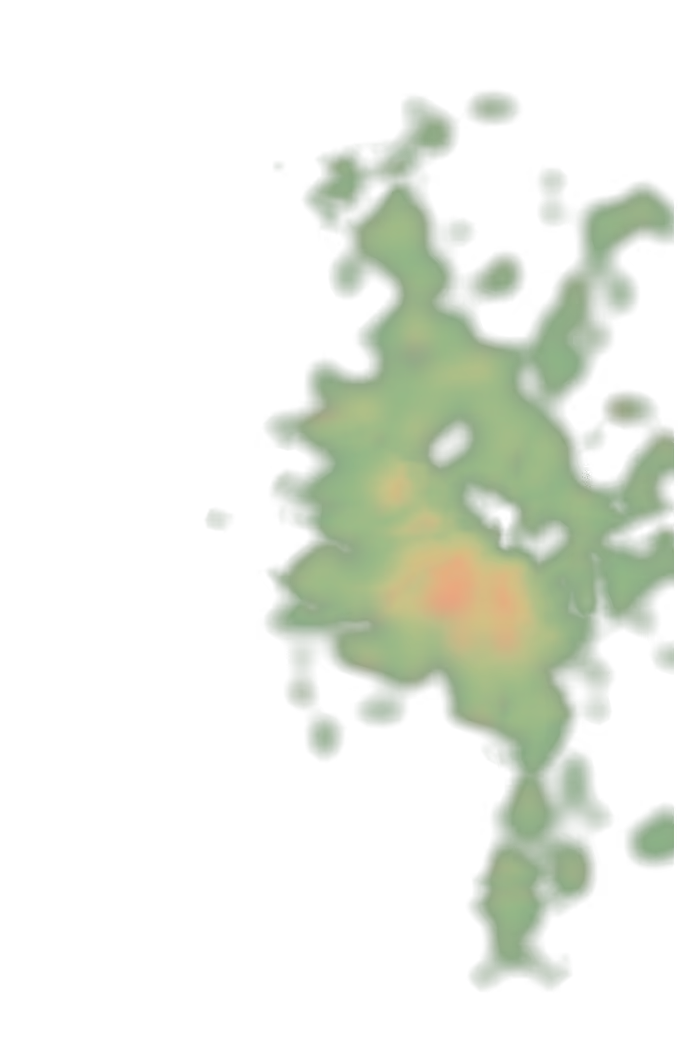

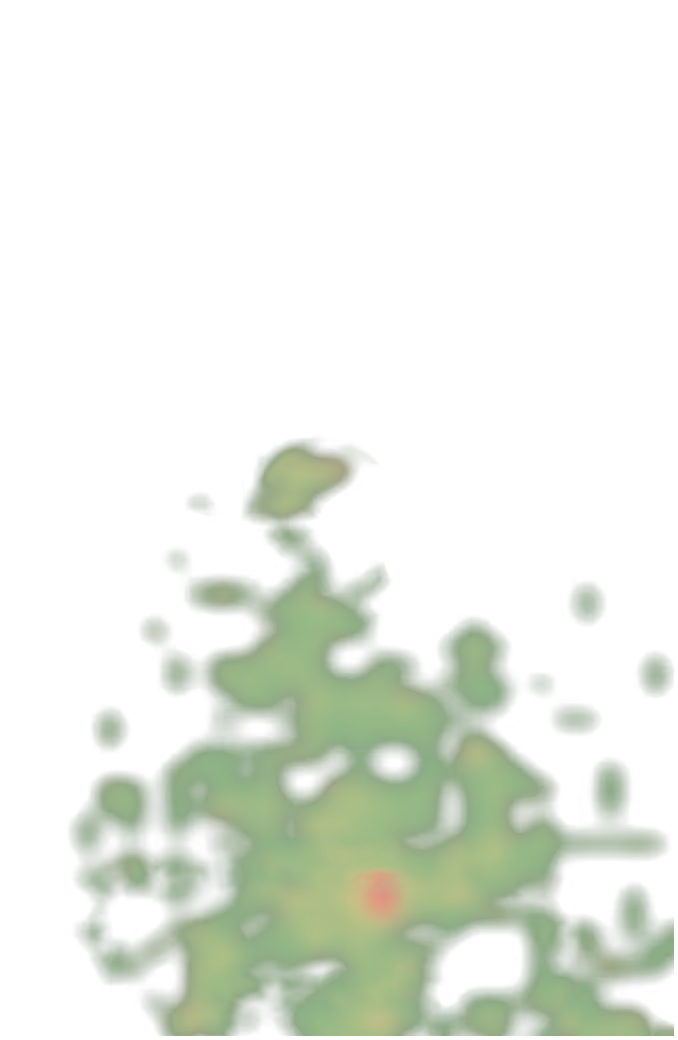

Solid in one zone. Open in another?
See where your team wins the ball back, and where the opponent gets through. Look at the whole team, or a single player’s actions across the match.
Ask about anything
Ask in plain language. Your AI assistant answers in seconds, using everything tracked in that match.
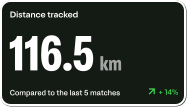
Speed and distance, live on the video
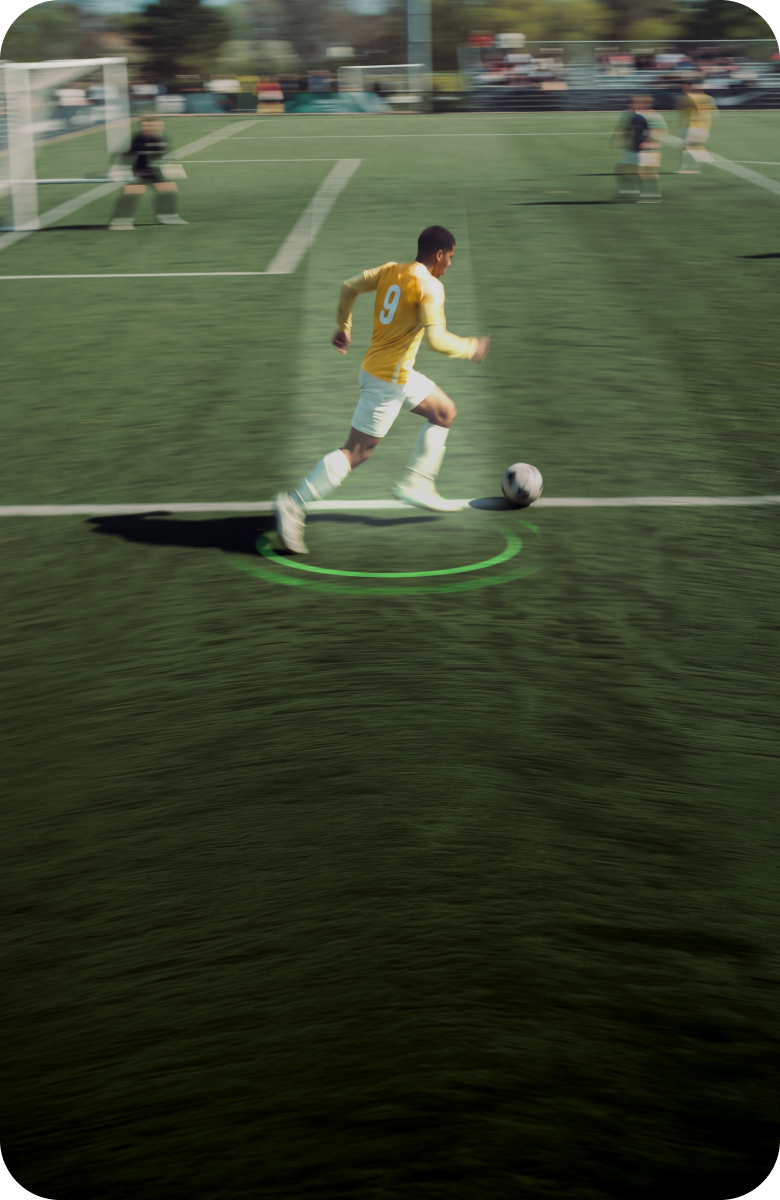
Every player's speed and distance overlaid on the footage, exactly where the action happened.
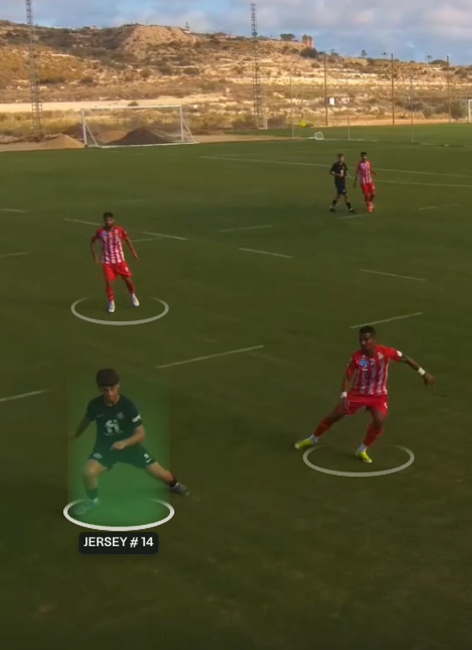
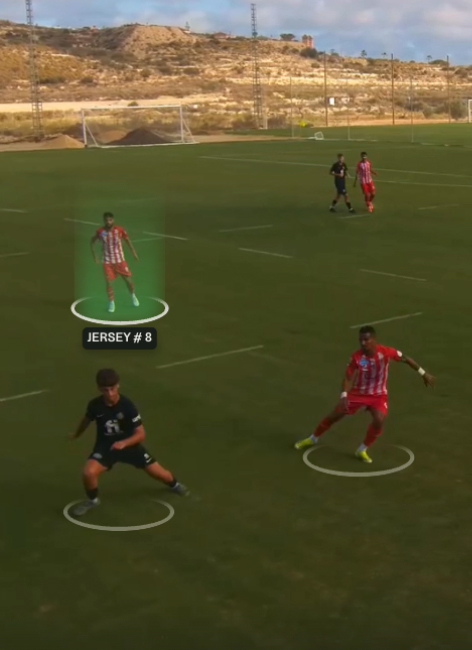
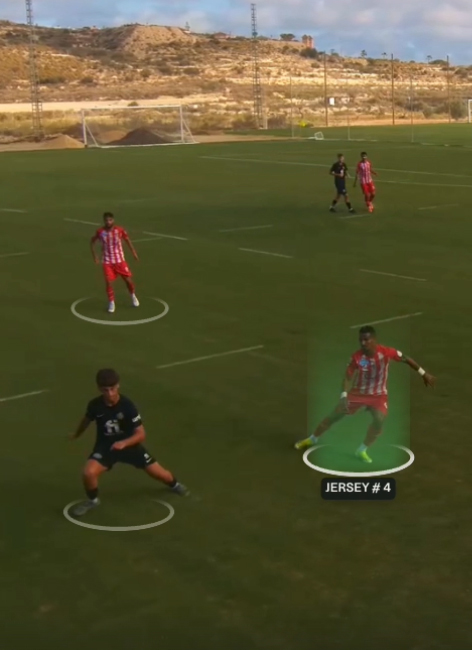

Every detail of the match, in every player's pocket
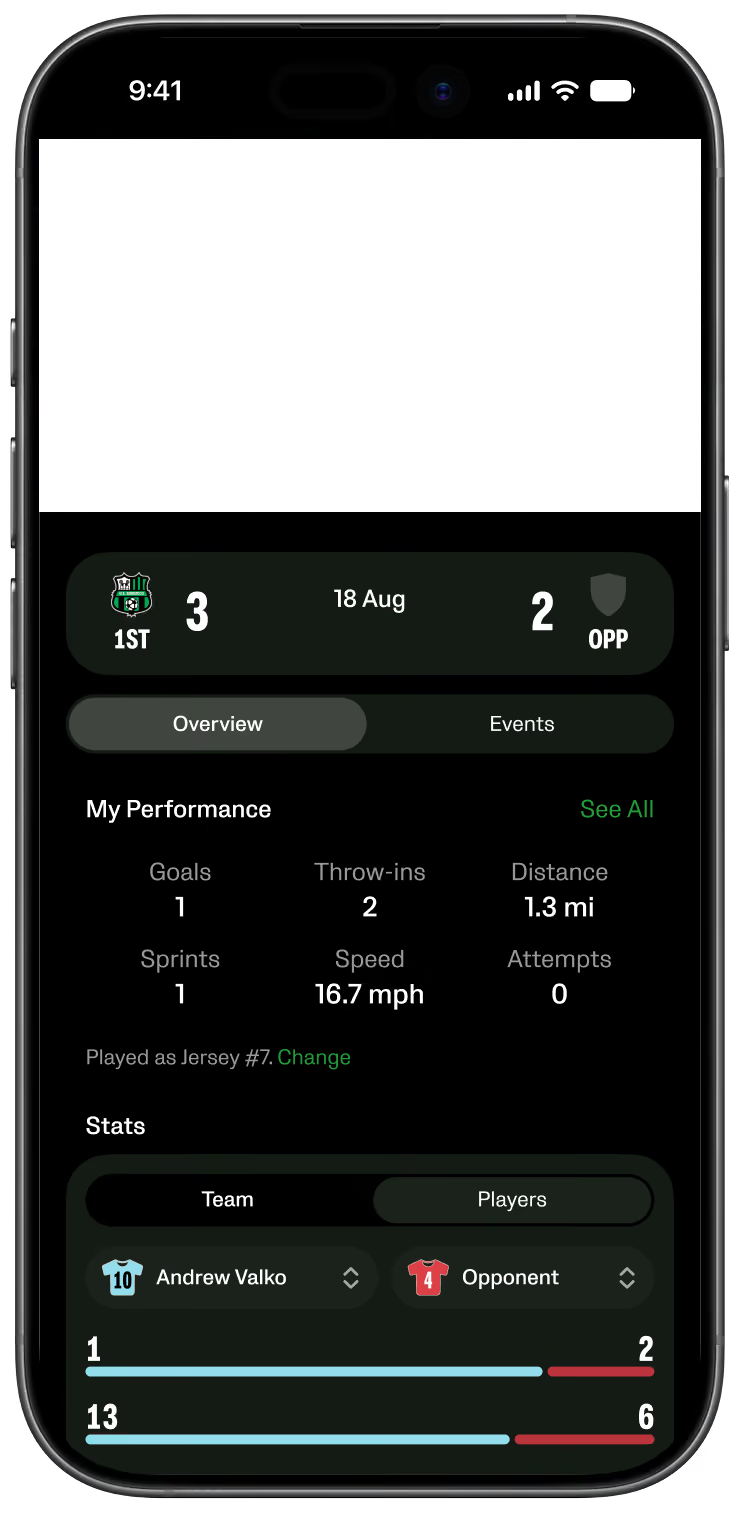
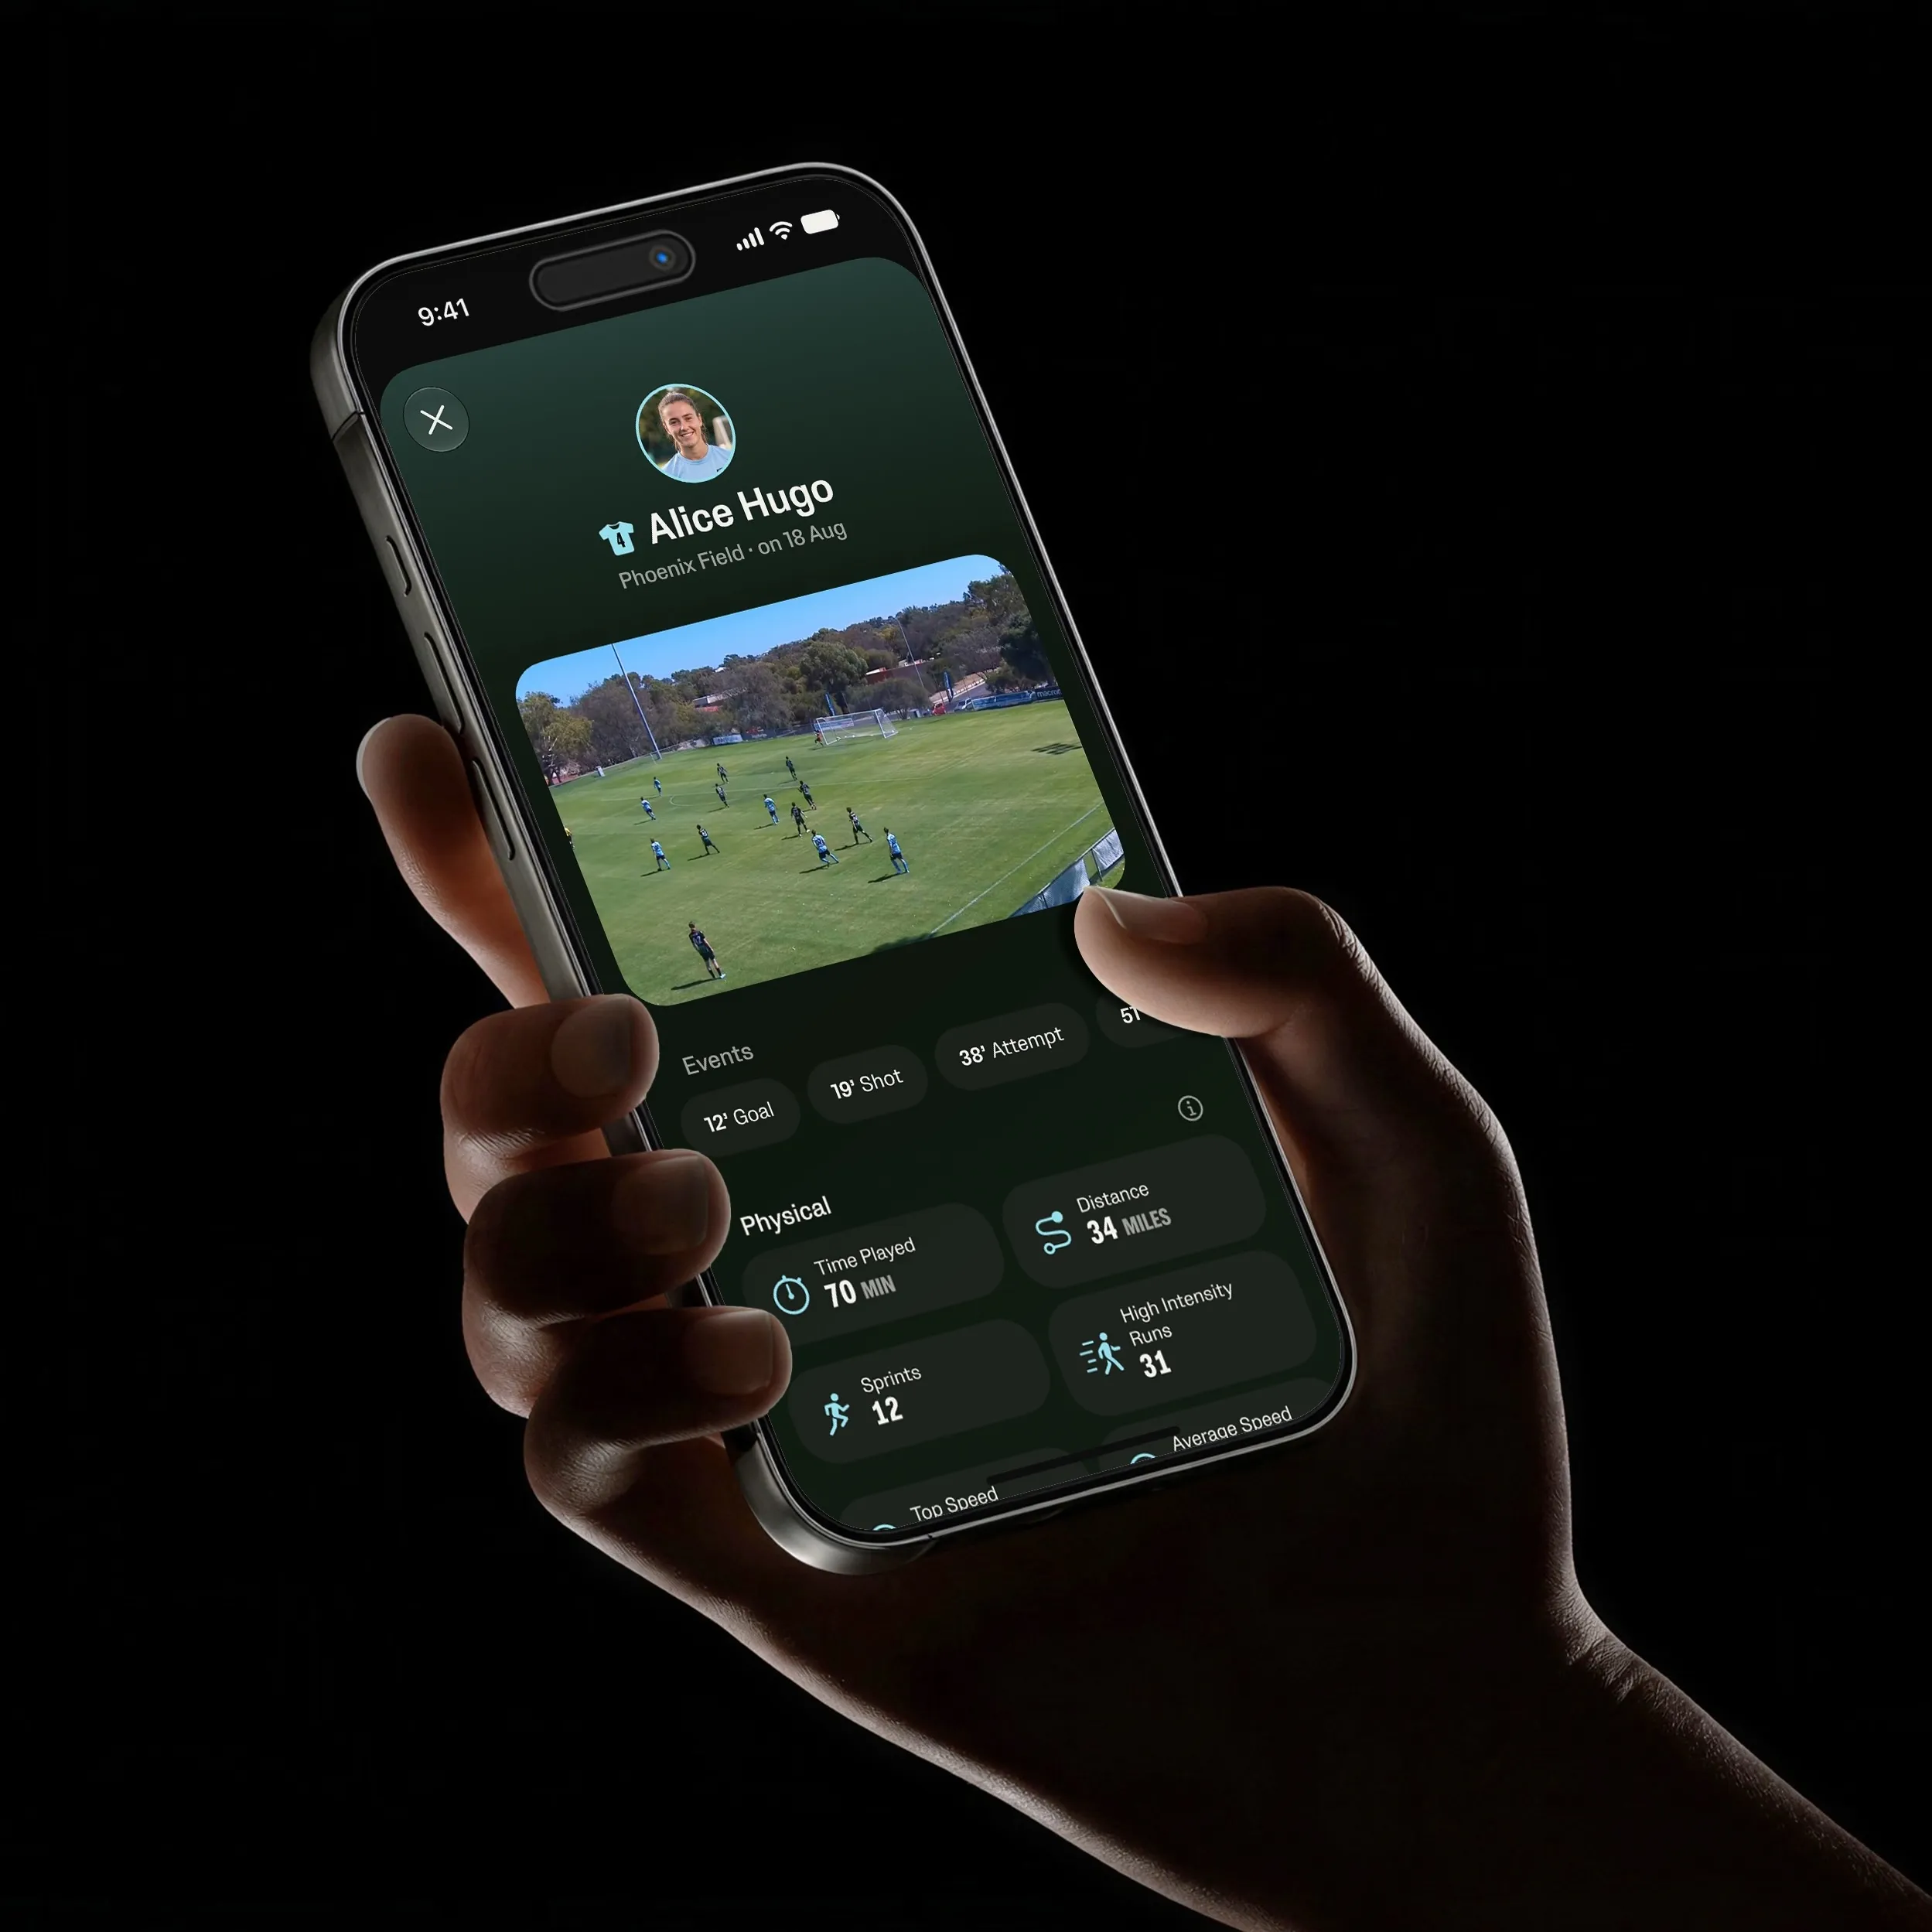
With Veo Analytics 2, every player can access the full data set in the Veo app: team stats, their own physical numbers, events like shots and tackles, and how they compare to the rest of the team.

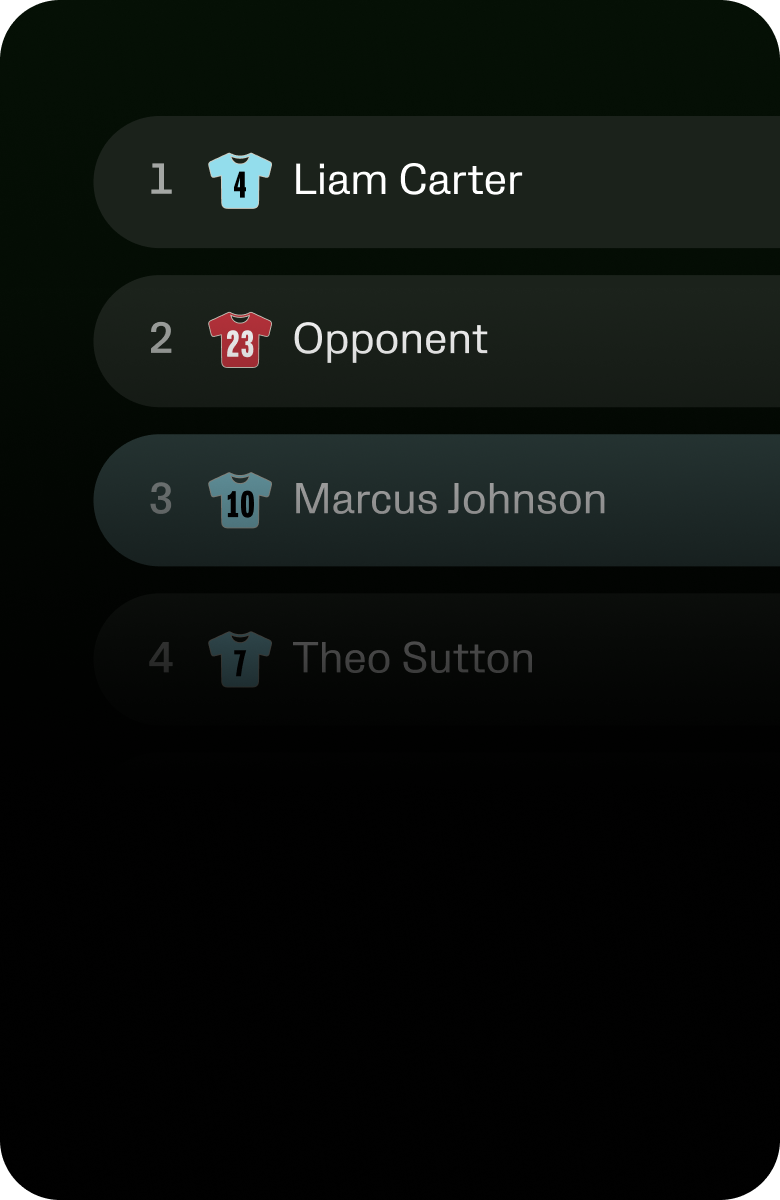
Compare match stats side by side
Identify trends across matches, evaluate player performance, and analyse team performance over time – all in one place.
See your team’s growth
Track how your team develops over time — season by season, or match by match.
Patterns you only see over time
Every game map now combines the data from your whole match library — so tendencies rise to the surface.
Compare team performances over time
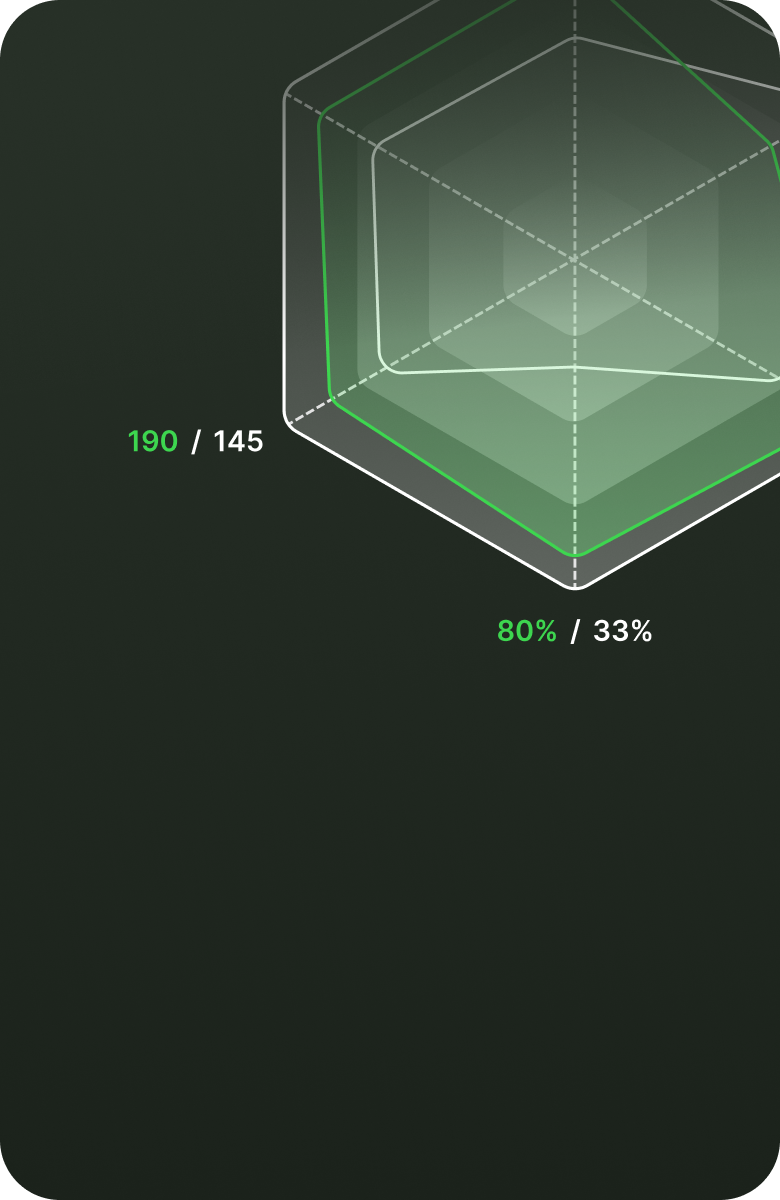
Put teams side by side — across your club, or your own team in different periods. The diamond shows how each performs on the metrics you pick.
Accurate data with zero manual work
AI detects every shot, pass and tackle and attributes it to the player who made it. A full match tagged and event-attributed in hours, not days. And you don't spend a minute doing it.
No GPS vests. Just video
AI reads top speed, sprints and distance straight out of the video you already record. No vests to hand out, nothing to charge, no data to sync afterwards.
The whole pitch, always in frame
Veo films the entire pitch at all times, not just the play in focus. Every player is tracked from kickoff to final whistle, including the ones far from the ball.